Warning: mysql_result() expects parameter 1 to be resource, boolean given in /var/www/cyberdyn/html/stats/stats.php on line 2
You are visitor no. since 10/14/2010 Visitors Online: Members Online: 0
Page updated:
|
INFRASTRUCTURE: HPCC - High Performance Computing Cluster
Cyberinfrastructure for Geodynamic Studies Related to the Vrancea Seismogenic Zone
HPCC/HPVC system is based on the new servers Dell PowerEdge R815 with 4 CPU, 12 cores (AMD 2.0 GHz) and 96-128 GB RAM. In order to test the performance of the parallel jobs on this system, we must run numerical codes parallelized with OpenMP, Matlab, and CitcomS. Until now, we run the following benchmarks for OpenMP, Matlab, and CitcomS:
OpenMP test on a computing node DellR815 with 48 de cores and 128GB RAM
OpenMP (Open Multi-Processing) is a multiplatform API (Application Programming Interface) which support multiprocessor programming with shared memory in C, C++ and Fortran on most of the processor architecture and for operating systems as Linux. OpenMP differs of OpenMPI, wich is used for multiprocessor programming with shared memory and can be scaled on hundreds and thousands of processors.
This test represents an aplication for matrix multiplication, in which we used the gcc4.1.2 compiler. We used 12, 24, 36 si 48 de cores and the results are bellow:
|
|
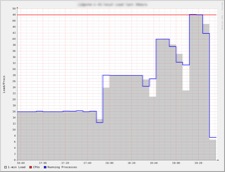
The processor usability for the 001 computing node during paralelized multiplication of a matrix. Vertical axis represents number of cores. Horizontal axis represents the execution time. Observe how the execution time decreases as increasing the number of cores.
|
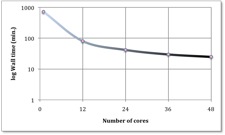
Execution time vs. number of cores.VErtical axis has logarithmic scale.
|
MatLab, Parallel Computing Toolbox and Distributed Computing Server on CyberDyn
MATLAB (www.mathworks.com) is a high-level language and interactive environment that enables you to perform computationally intensive tasks faster than with traditional programming languages such as C, C++, and Fortran. Matlab has two toolboxes in order to perform parallel computations: Parallel Computing Toolbox (PCT) and Distributed Computing Server (DCS). PCT lets you solve computationally and data-intensive problems using multicore processors, GPUs, and computer clusters. High-level constructs—parallel for-loops, special array types, and parallelized numerical algorithms—let you parallelize MATLAB applications without CUDA or MPI programming. The toolbox provides eight workers (MATLAB computational engines; at CyberDyn we have a license for 8 workers) to execute applications locally on a multicore desktop/workstation. You can run the same application on a computer cluster or a grid computing service (using MATLAB DCS). You can run parallel applications interactively or in batch.
This test represents an application for pi calculation using Monte-Carlo method (serial and parallel). We used 1, 2, 4, and 8 cores and the results are the following:
|
| Number of Workers |
Wall time (sec.) |
| 1 |
1488 |
| 2 |
795 |
| 4 |
409 |
| 8 |
204 |
|
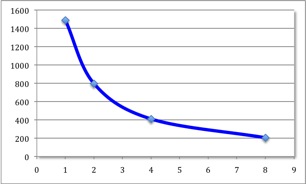
Now, let’s look at the results. As you can see we obtained a nice speedup, using a serial code (1 worker) the code needed almost 25 minutes to complete. On the other hand, using 8 workers, the code finished in around 3 minutes.
|
CitcomS (parallelized FEM package) tests on Cyberdyn
CitcomS is a finite element code written in C that solves for thermo-chemical convection within a spherical shell. It can solve for problems within either a full or a restricted spherical domain. Although the code is capable of solving many different kinds of convection problems using the flexibility of finite elements, there are aspects of CitcomS which make it well-suited for solving problems in which the plate tectonic history is incorporated. Variable viscosity, including temperature-, pressure-, position-, composition-, and stress-dependent viscosity are all possible.
A/Here we present benchmark results using a regional model which spans 1x1 radians in surface and from surface down to the core mantle boundary. We used several model resolutions, from 17x17x9 nodes to 257x257x129 FEM nodes (or 400 km x 400 km x 438 km to 25 km x 25 km x 27 km) and an increased number of computing cores from 4 to 1024 processors.
Several important conclusions can be drawn: for low model resolutions (17x17x9 or 33x33x17 FEM nodes) the minimum computing time is obtained using 16-32 computing cores. Using a larger number of processors will result in an increasing computing time due to network communication among computing nodes. However, for high resolution models (129x129x65 or 257x257x129 FEM nodes) the FEM code scales very well, the wall time decreasing continuously from several days (for 4 cores) to several hours when using 1024 computing cores.
|
|
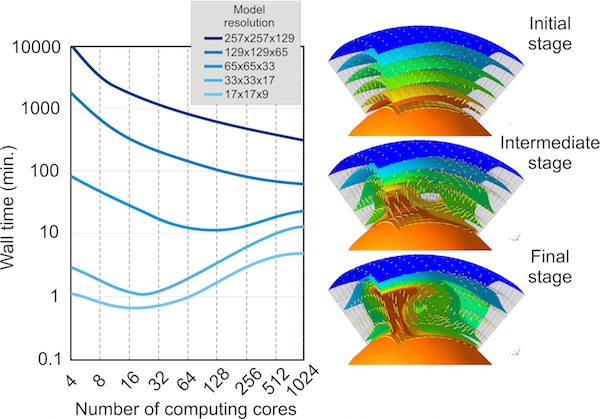
Benchmark test using CitcomS regional model: Left: performance test using a gradually increased mesh resolution.
Right: the model output for three time steps. Colored isosurfaces represent different isotherms, and yellow arrows depict the model flow. Orange sphere at the base represents the hot Earth's iron core. This was plotted using OpenDX.
|
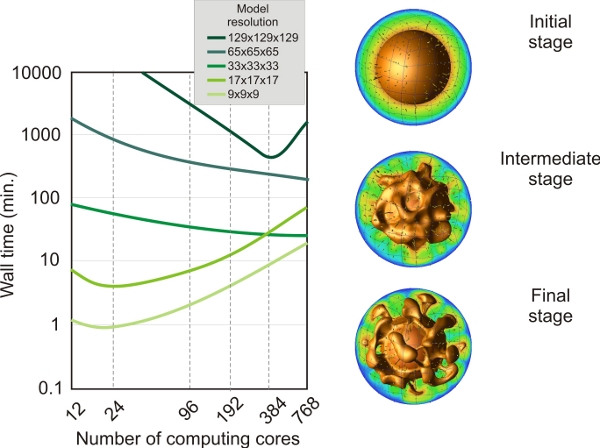
B/This is another benchmark performed using CitcomS, but in this case we use a full spherical model for a purely thermal convection problem. The full spherical version of CitcomS is designed to run on a cluster that decomposes the spherical shell into 12 equal “caps” and then distributes the calculation for caps onto separate processors. We used several model resolutions, from 9x9x9 nodes to 129x129x129 FEM nodes and from 12 (12 caps x 1 x 1 x 1) to 768 (12 caps x 4 x 4 x 4) computing cores. Several important conclusions can be drawn: for low model resolutions (9x9x9 or 17x17x17 FEM nodes) the minimum computing time is obtained using 24-96 computing cores. Using a larger number of processors will result in an increasing computing time due to network communication among computing nodes. However, for high-resolution models (i.e. 129x129x129 FEM nodes) the wall time decreases continuously from several days (for 24 cores) to several hours when using 768 computing cores.
|
|
Benchmark test using CitcomS full-spherical model. Left: performance test using a gradually increased number of computing cores and mesh resolution. Right: the model output for three time steps. Colored isosurfaces represent different isotherms, and yellow arrows depict the model flow. The sphere in the middle of the model from where the thermal plumes initiates represents the hot Earth’s iron core. Plots were produced using OpenDX.
|
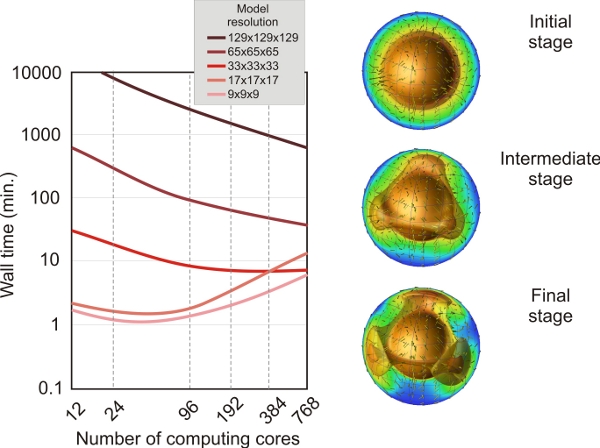
C/Here we performed a more complex benchmark using CitcomS, in this case we use a full spherical model for a thermo-chemical convection problem where the density anomalies due to the composition and thermal heterogeneities drive the convection flow. The full spherical version of CitcomS is designed to run on a cluster that decomposes the spherical shell into 12 equal “caps” and then distributes the calculation for caps onto separate processors. The code uses tracers in order to track the chemical composition inside the Earth. We use a number of 20 tracers per finite element. We used several model resolutions, from 9x9x9 nodes to 129x129x129 FEM nodes and from 12 (12 caps x 1 x 1 x 1) to 768 (12 caps x 4 x 4 x 4) computing cores. The number of tracers varies from over 6000 for the lowest resolution models, to over 25 millions for the highest resolution models. Several important conclusions can be drawn: for low model resolutions (9x9x9 or 17x17x17 FEM nodes) the minimum computing time is obtained using 12-24 computing cores. Using a larger number of processors will result in an increasing computing time due to network communication among computing nodes. On the other hand, for high-resolution models (i.e. 33x33x33 or 65x65x65 FEM nodes) the wall time decreases continuously from several days (for 12 cores) to several hours when using 768 computing cores. However, for the highest resolution modes (129x129x129 FEM nodes and over 25 millions of tracers) the minimum wall time is obtained when using 384 computing cores. Using more cores (i.e. 768), the wall time increases from several hours to more than one day.
|
|
Benchmark test using CitcomS full-spherical model for a thermo-chemical convection problem. Left: performance test using a gradually increased number of computing cores and mesh resolution. Right: the model output for three time steps. Colored isosurface represents a specific isotherm (0.8 of non-dimensional temperature), and yellow arrows depict the model flow. The sphere in the middle of the model from where the thermal plumes initiates represents the hot Earth’s iron core. Plots were produced using OpenDX.
|
|